03/10/2016
This page is a brief introduction to hyperspectral imagery and my current graduate school research. It’s specifically written with a general audience in mind, so I hope you find it useful and informative, and maybe even interesting!
So, what is a hyperspectral image?
Most of us are familiar with the idea of an image being composed of pixels (picture elements). Each of these pixels has its own color, determined by the spectrum of the material present within that pixel. Spectrum is really just a fancy word for rainbow, and every material has a unique spectrum associated with it, just like all humans have unique fingerprints. The spectrum measures the light intensity of the material across all wavelengths in the electromagnetic spectrum (Figure 1).
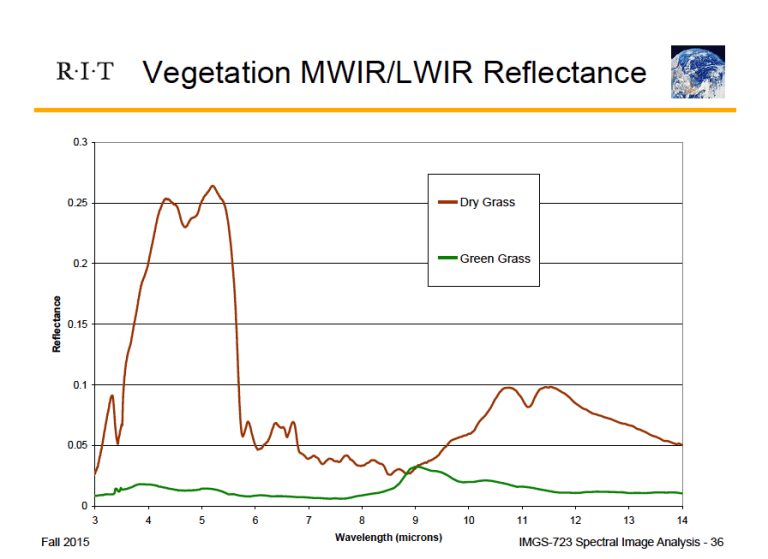
In Figure 1 we see the spectra for both dry and healthy grass. Their reflectances vary drastically from ~4-6 microns. If we could capture this information in an image, then it would theoretically be possible to determine where dry and healthy grass are located. If the image was taken from an airborne sensor and showed a wide swath of land, this could be enormously helpful for farmers in monitoring crop health. Remember, these differences are not just present for dry and healthy grass. Every material has a unique spectrum.
Now let’s take a step back from thinking about the full spectrum of materials. The pictures we take with our phones and consumer cameras are composed of three components: a red, green, and blue layer, captured through the use of different filters. These three layers combine to give us the full-color images we are used to seeing (Figure 2).
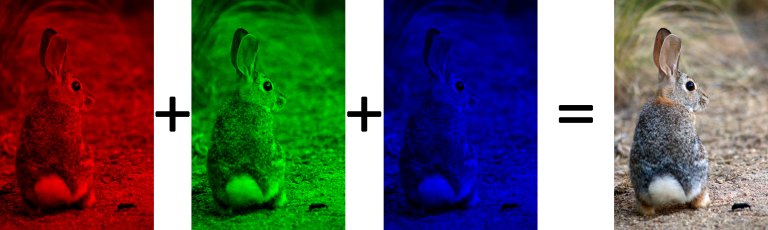
Now, in Figure 2, and in the information our cameras collect, we don’t get the material reflectance at every single wavelength. We get the reflectance of all combined red wavelengths, all combined green wavelengths, and all combined blue wavelengths, which join to form a true-color image. So while we can make pretty pictures out of this three-band information, it doesn’t provide us with much information.
This is where hyperspectral imaging comes in. Instead of broadband filters (all red, all green, all blue), we use a different instrument called a spectrograph to collect the full spectrum of every pixel in an image (Figure 3). The term hyper typically means that we are collecting the reflectance values at hundreds of wavelengths. Multi means tens of wavelengths, and filters come back into play.

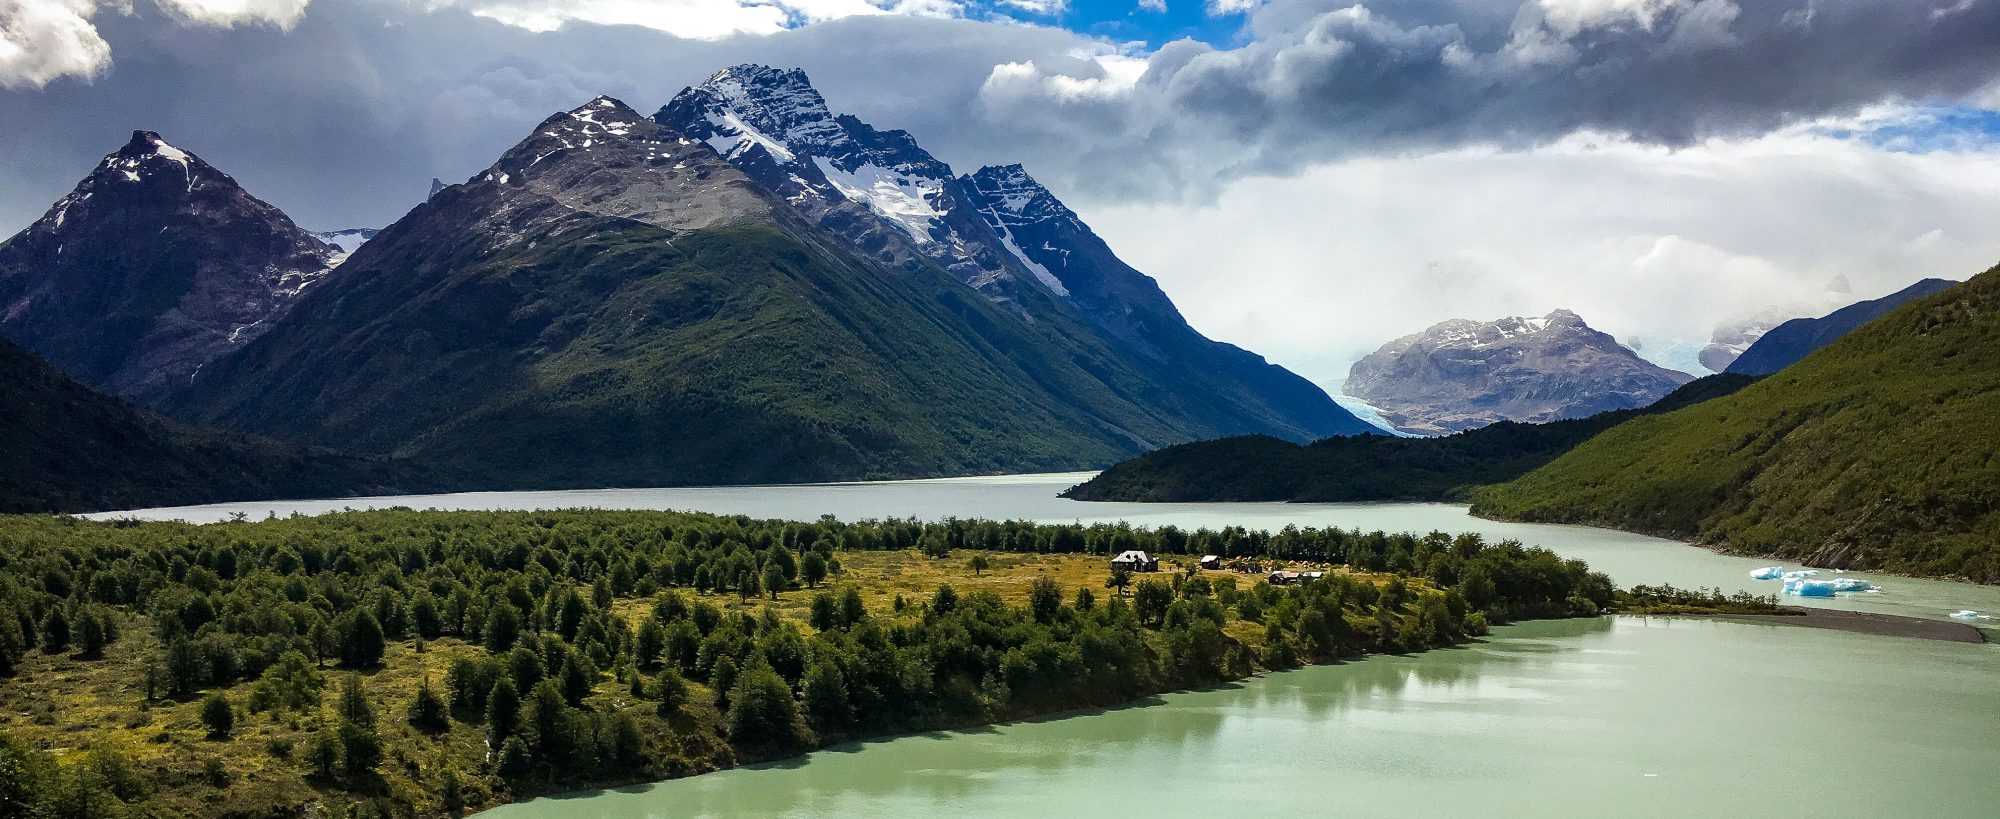
In Figure 3 we can start to visualize some of this data in three dimensions. The top of the cube in Figure 3 shows a true-color image formed by three combined wavelengths of the collected information (red, green, and blue). This gives us an idea of the scene we are looking at, the intersection of a grassy park and a large lake. The columns down the side of the cube represent the spectrum associated with each pixel. So if you removed a slice from the middle of this image stack (like a Jenga block), you would be looking at the image represented by one wavelength. Since you only have one wavelength (one color) of information, the image will only vary in intensity. Information about each pixel is represented by its brightness. For instance, if we go back to look at Figure 1 and imagine a hyperspectral image of a farm, we could extract the wavelength layer corresponding to 5 microns. In the resulting reflectance image, dry grass would appear extremely bright (close to white), and healthy grass would be very dark (closer to black).
Back to Figure 3, you’ll notice that a couple of the wavelength layers are almost black. These layers may correspond to bad bands (wavelengths) that are missing due to a malfunction in the instrument, or more commonly because of the atmospheric effects seen by a satellite. At certain wavelengths, the atmosphere is totally opaque, and no useful information is obtained about the ground materials. Every little bit of useless information we can remove will help, because these datasets are absolutely massive. The images I worked with for this project had over ten million values of information.
What is hyperspectral imagery good for?
Continuing with the comparison of dry and healthy grass, this is an example of classification. We can write computer code that will inspect the spectral information of each pixel and assign it to a class. Now, the computer isn’t that smart; they’re technically just clusters of similar pixels. It’s up to the image analyst to go back and assign labels to each class (i.e. grass, trees, dirt, roads, water, etc.). See Figure 4 for an example and more details.

Another possibility with hyperspectral imagery is anomaly detection (the current focus of my work). This resembles the classification problem, except that there are only two classes: “normal” pixels, and “anomalous” pixels. Basically, you can compute the average spectrum of the entire image, and compare each pixel spectrum to that average. Large differences between the image pixel and the average spectrum indicate that the pixel is likely anomalous.
A classic example of anomaly detection is an image of pure vegetation, with camouflage tents and tarps mixed in. Similar to Figure 2, an RGB image wouldn’t provide much information, and the tarps would easily blend into the vegetation. However, the spectrum of plastic and trees/grass differ significantly and this becomes an easy detection problem. An example of anomaly detection is shown in Figure 5.

Anomaly detection is the case where we don’t have any information about what we’re looking for; we just want to find things in the image that aren’t quite right. This leads us to consider exactly what is an anomaly? For instance, an image of a lake, with a small wooden dock sticking out over the water. Humans would see this and think “okay that makes sense,” whereas a computer sees this and returns “ANOMALY ANOMALY!!” The task of giving computers a human context to work with is enormously difficult.
The next step after anomaly detection is target detection. In this case, we know what we are looking for, or what material we are interested in. Now instead of comparing each image pixel to the average image spectrum, we basically compare each image pixel to the known spectrum of the material of interest. The material spectrum is normally measured in a lab, which means that atmospheric effects are not taken into account. As an example, consider an image of the ocean in contested territory. It would be of interest to monitor any incoming or outgoing vessels, and the material of a ship would significantly vary from the ocean. Since in this case we know exactly what we are looking for, the problem becomes one of target detection. See Figure 6 for an example of this work.

The possibilities are endless, but to wrap this up I’ll mention one more application of hyperspectral imaging: change detection. This requires multiple hyperspectral images of the same area, but by comparing the spectra of pixels on one day compared another, it becomes easy to highlight where changes are occurring. This could be breaking ground for a new building, forests or crops suffering from a drought, or monitoring deforestation, among many other things. In fact, the previous example of ships in contested waters also applies to change detection.
Of course, the above examples are all done with very basic data used for in-class examples and practice. It’s up to you to use your imagination and figure out everything else that could be accomplished with these techniques. Figure 7 shows one practical example implemented by the Rochester Institute of Technology’s Center for Imaging Science.

When and where is hyperspectral imagery acquired?
I had to continue with the who/what/when/where/why theme, at least somewhat.
Hyperspectral imagery can be acquired in many ways. For remote sensing applications, the two most common ways are airborne vehicles that fly at low altitudes and have high ground resolution, and satellites that operate above the Earth’s atmosphere (although almost all satellites are multispectral).

While airborne vehicles can gather higher resolution imagery over specific locations, it requires a lot more time to investigate flight paths and schedule flyovers. Satellite imagery on the other hand, comes on a regular basis. Unfortunately, satellite repeat visits take too long for many new applications and ideas. Even for applications that would only require satellite imagery once a week, pesky clouds have a habit of disrupting observations, especially in Rochester!
Finally, why am I studying hyperspectral imagery?
We’ve already covered this somewhat. One reason is that multispectral or RGB images just don’t provide enough information to make useful observations. We need continuous spectra covering hundreds of wavelengths, but humans simply can’t compare that much information. Remember the camouflage tarp vs. grass/trees example. We would fail miserably trying to separate out tarps from vegetation if we just had an RGB image. Computers do the hard work for us, comparing hundreds of values against hundreds of other values to find similarities and differences, which we can then convert back into an easy-to-comprehend format.
Second, even if humans were capable of this work, the huge factor is time. We can acquire enormous datasets, and there simply are not enough people to pore over all the data. Especially in fields where information is needed fast, using computers to analyze hyperspectral imagery is imperative.
So for me, hyperspectral imagery is attractive because I get to work with computers and write code, I get to automate tasks which will save time, and I can see the impacts of my work in real life.
If you’re still reading, WOW, I’m impressed. I find this stuff exciting and fascinating, but it’s hard to tell how other people would feel about it when I live in a little academic bubble. I hope this was informative and you learned a lot; feel free to leave a comment with any questions or suggestions!
